


By: Professor Andi Curcio & Dean Alexis Martinez
Experience confirms using rubrics to assess institutional learning outcomes is relatively easy and cost-effective. It is also an iterative process. Below we share some of the lessons we learned as we engaged in this rubric-based institutional assessment process. We also share examples of final report charts to illustrate how this process results in usable assessment report data.
A Review of the Basics
Georgia State University College of Law has institutional outcomes that encompass the ABA required legal knowledge, analysis, research and writing outcomes as well as outcomes covering self-reflection, professional development, ethical and professional obligations, teamwork, ability to work effectively with courts and clients, and awareness of pro bono responsibilities.
An earlier blog and article provide an in-depth discussion about the development and use of rubrics to assess these institutional outcomes.
To briefly review the main idea: we engaged faculty in designing rubrics with measurable criterion for each institutional outcome.
For example, for our legal knowledge and analysis outcomes, our criterion included: substantive legal knowledge; issue spotting; fact usage; critical analysis; and policy analysis. For each criterion, we identified a continuum of competence.
For example, for issue spotting, the rubric looked like this:

As the excerpt above illustrates, we drafted rubrics so that faculty teaching a wide range of courses could use the rubric, regardless of course content or assessment methodology.
For each outcome, we identified multiple first year and upper level courses that would provide a solid student sample and used those courses to measure the outcome. In the designated courses, faculty graded as usual and then completed a rubric for each student.
Faculty did not have to change how they taught or assessed and the only extra work was completing a rubric – a process the faculty agreed took little additional time.
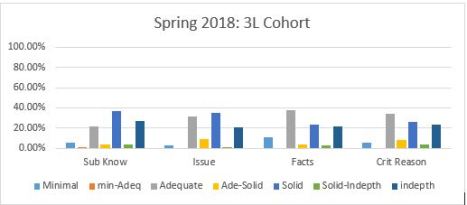
All data was entered from the completed rubrics into one master database and used to create a faculty report identifying student achievement, by cohort year (1L,2L 3L) for each rubric criterion [see sample below].
Lessons Learned:
1. Drafting Rubrics
We struggled to draft rubrics that could be easily adapted to a wide range of courses. If we were starting from scratch, it might have been easier if we used the rubrics drafted by the American Association of Colleges and Universities [AAC&U] as a starting point. Those rubrics have been developed and tested for reliability and validity. They also look at the big picture skills.
Because law faculty often think in context of how individual courses are taught it was sometimes challenging for faculty to start from scratch and draft rubrics that could be easily applied across the curriculum. Starting with the AAC&U rubrics allows faculty members to review examples of language and how larger/generalized program outcomes could be assessed through multiple different teaching methods and in a wide range of courses.
We also learned that it works best if we keep the rubrics to one page per learning outcome. Although outcomes could have a lot of criterion, it is important to identify 4-5 key criteria. Keeping the rubrics to one page forces us to hone in on the critical skills and helps ensure that the process is not overly burdensome for either faculty completing the rubric or staff entering the rubric data. It also makes reporting the data more manageable.
We also found it useful to remind faculty that the institutional rubrics are not meant to capture all skills taught in a given course and that we did not expect all faculty to assess every rubric criterion which is why we included a “N/A” [not applicable] choice for each criterion.
Finally, we found it helpful to emphasize that while we cannot change the rubrics mid-year, we welcome feedback and are open to changing future rubric iterations based upon faculty input. This keeps the faculty engaged and ensures the rubrics are as meaningful as possible.
2. Labeling Criterion Levels
Originally, we drafted rubrics and labeled each criterion level with word descriptors such as: needs significant help; developing; competent; and aspirational. Faculty found those labels more confusing than helpful. We thus changed the continuum labels to: level 1, level 2, etc. This change made it easier for faculty to focus on the descriptors along the continuum, rather than the achievement labels. It also eliminated any concerns about how the data collected could be used in the future, either internally or externally, to describe the quality of current and future graduates.
3. Data Compilation and Report Format
We chose a wide variety of 1L and upper level courses to get a robust data sample. In each course assessed, the professor completed a rubric for each student. Professors used anonymous exam numbers for the rubrics, just like for grading.
Initially, each rubric submitted was a data point. However, we realized that some students were taking multiple courses used in our data collection while others took only one course. To address the issue of “double counting” some of the same students, we changed our data entry system so that each student became a data point.
To the extent students took multiple courses where the outcome was measured, and they were rated differently by different professors, we averaged their score. Thus, if a student was at a Level 2 in issue spotting in Con Law II and a level 3 in issue spotting in Administrative Law, the student was entered into the program as a 2.5 for issue spotting. That also allowed us to have a more granular final report because instead of having four levels, we had seven.
The charts below illustrate what final data compilation might look like using that data entry system.

After experimenting with developing a software program to compile the data, we discovered it was cheaper, and significantly simpler, to use excel for data entry and basic data compilation. The excel option also allows for future entry into SPSS for additional correlations or data analysis.
As we move forward in assessing additional outcomes this year, we are experimenting with moving from hard copy to electronic rubrics to ease the administrative burden of data entry of hard copy rubrics.
There are multiple software options, such as Qualtrics, that allow for the same questions included in hard copy rubrics to be organized electronically for reports to be run quickly and efficiently.
4. Using the Report Data to Improve Learning
After compiling the data, the assessment committee reported out the analysis in a short, factual report to the faculty using the chart format above and some additional explanatory narrative.
Throughout the reporting process and ensuing discussions about how to use the data, we reminded faculty that the point of outcome measures is to improve student learning [something we all care about].
We also were very upfront about issues with methodology that produced imperfect results, and we reminded faculty that our goal was an overview, not a publishable paper. Reminders about why we are engaging in the process and transparency about imperfections in the process went a long way toward moving the discussion forward.
We used the report as a starting point for a big picture discussion. After briefly reviewing the report with the faculty, we asked the faculty to break out into small groups and answer questions such as: given the data on 1Ls, are we satisfied with where our 1Ls are at the end of the first year? If not, what changes should we consider to help improve their learning?
By engaging the faculty in answering specific questions, we got great feedback that we turned into recommendations/action steps that led to further discussions. Eventually we adopted action steps that we have begun implementing in the hope that we can improve student learning. For example, based upon the data and the experience using the rubrics, faculty agreed to develop criterion-referenced rubrics for their own courses so that students had more information than simply a curved grade by which to assess their progress.
Conclusion
Institutional outcomes assessment is a new process for most law schools. It is also an iterative one. We learn as we go along and make changes as necessary. At GSU, we changed our data compilation methods and tweaked the rubrics. We expect to continue rubric revision as we become more familiar with the process.
What we have learned is that the rubric assessment process is fairly easy to implement, cost-effective, and can provide us useful information as we continually strive to improve our students’ learning.
Filed under: Uncategorized |


Thank you for sharing your lessons learned. Georgia State UCL appears to be a significant thought leader in this area. Congratulations! Already the chair of our law school Assessment Committee, Professor Nancy Maurer, sent your blog post to the committee for consideration about whether we want to adopt some of these lessons. Also our Instructional Technologist (an BP BLOG contributor) Dr. Patty Baia wondered whether your switch to numbers would also work better for our external evaluators such as field supervisors. You have given our very reflective committee here at Albany Law food for thought. Really helpful post!